Find the average of decreased amount (in Rs.) of the items which have shown decrease.
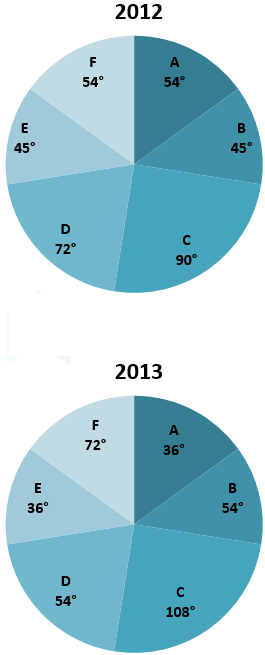
Directions: Study the following pie-charts carefully and answer accordingly. The pie-charts show the distribution of expenses over the six different items A, B, C, D, E and F of a person for 2012 and 2013. He spent Rs. 36000 in 2012 and Rs. 40000 in 2013.
সঠিক উত্তর: Option C
Since it can be seen for the above pie chart that the expenses of the items A, D, and E decreases from 54o to 45o, 72o to 54o and 45o to 36o respectively
∴ Angle subtended by A, D, and E in 2012 = 54o + 72o + 45o = 171o
∵ Total amount spent in 2012 = Rs. 36000
∴ Amount spent on A, D, and E in 2012 \(= \frac{{171}}{{360}} \times 36000 = {\rm{Rs}}.17100\)
∴ Angle subtended by A, D, and E in 2013 = 36o + 54o + 36o = 126o
∵ Total amount spent in 2013 = Rs. 40000
∴ Amount spent on A, D, and E in 2013 \(= \frac{{126}}{{360}} \times 40000 = {\rm{Rs}}.14000\)
∴ Decreased amount of the items = 17100 – 14000 = Rs. 3100
∴ Average of decreased amount of the items A, D, and E = 3100/3 = 1033.33
