Bar Graph (20 টি প্রশ্ন )

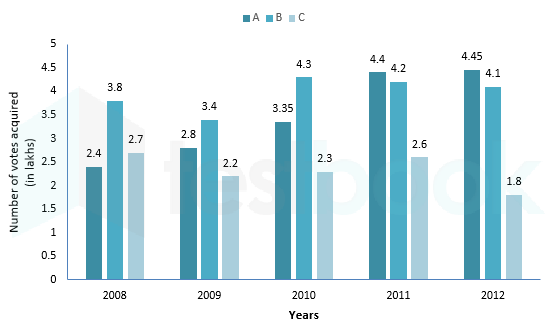
Passage :

Direction: Study the following graph to answer the questions given below it.

The bar graph shows the performance of 3 political parties A, B and C in terms of votes acquired in the election in a constituency during 2008 to 2012.

i
ব্যাখ্যা (Explanation):

From the given data,

Total number of votes acquired by all the three parties in 2009 (in lakhs) = 2.8 + 3.4 + 2.2 = 8.4

Number of votes acquired by B in 2009 (in lakhs) = 3.4

Required percentage \(= \;\frac{{3.4}}{{8.4}} \times 100\; = \;40.05\%\)

i
ব্যাখ্যা (Explanation):

From the given data,

Number of votes acquired by B in 2011 (in lakhs) = 4.2

Number of votes 12% more than that acquired by B(in lakhs) = 4.2 + (12% of 4.2) = 4.704

Number of votes acquired by C in 2011 (in lakhs) = 2.6

Minimum % increase required by C to exceed number of votes of B \(= \;\frac{{4.704\; - \;2.6}}{{2.6}} \times 100 = 80.9\%\)

i
ব্যাখ্যা (Explanation):

From the given data,

Total number of votes acquired by B during 2008-2011 (in lakhs) = 3.8 + 3.4 + 4.3 + 4.2 = 15.7

Average number of votes acquired by B during 2008-2011 (in lakhs) = 15.7/4 = 3.925

Number of votes acquired by B during 2012 (in lakhs) = 4.1

Required % to maintain average\(= \;\frac{{3.925 - 4.1}}{{4.1}} \times 100\; = \; - 4.3\)

Negative sign shows the % should be decreased.

∴the votes of B in 2012 should decrease by 4.3% in 2012 in order to maintain the average.

i
ব্যাখ্যা (Explanation):

From the given data,

Number of votes acquired by A in 2012 (in lakhs) = 4.45

Number of votes acquired by C in 2012 (in lakhs) = 1.8

Required ratio of votes in 2013 (C : A) = 3 : 2

Total number of votes required by C in 2013 (in lakhs)\(= \;\frac{3}{2} \times 4.45\; = \;6.675\)

Number of votes required in 2013 than in 2012 (in lakhs) = 6.675 – 1.8 = 4.875

i
ব্যাখ্যা (Explanation):

From the given data,

Total number of votes acquired by A during 2008-2012 (in lakhs) = 2.4 + 2.8 + 3.35 + 4.4 + 4.45 = 17.4

Average number of votes acquired by A during 2008-2012 (in lakhs) = 17.4/5 = 3.48

Total number of votes acquired by B during 2008-2012 (in lakhs) = 3.8 + 3.4 + 4.3 + 4.2 + 4.1 = 19.8

Average number of votes acquired by B during 2008-2012 (in lakhs) = 19.8/5 = 3.96

Required percentage \(= \;\frac{{3.96 - 3.48}}{{3.48}} \times 100\; = \;13.79 \approx 14\)

Passage :

Directions: Study the graph to answer the following questions:

The following graph shows the production of rice and all food-grain in India

i
ব্যাখ্যা (Explanation):

Average production of rice =\(\frac{{sum\;of\;production\;of\;rice\;in\;given\;years}}{{number\;of\;years}}\)

⇒Average production of rice =\(\frac{{81 + 82 + 86 + 89 + 85 + 93}}{6}\)

= (516/6) m tonnes

= 86 m tonnes

Maximum recorded production of food grain over the years = 120 m tonnes

∴ Percentage of average production of rice to maximum production of food grains over the years = (86/120) × 100

≈ 71.7%

i
ব্যাখ্যা (Explanation):

   ∴ Percent decrease in food grain production is maximum in case of 1997-98 

i
ব্যাখ্যা (Explanation):

Average production of rice = (sum of production of rice in given years)/(number of years)

⇒ Average production of rice =\(\frac{{81 + 82 + 86 + 89 + 85 + 93}}{6}\)

= (516/6) m tonnes

= 86 m tones

i
ব্যাখ্যা (Explanation):

Clearly, share of production of rice in total food grain production is highest in 2001-02.


ফ্রিতে ২ লাখ প্রশ্নের টপিক, সাব-টপিক ভিত্তিক ও ১০০০+ জব শুলুশন্স বিস্তারিতে ব্যাখ্যাসহ পড়তে ও আপনার পড়ার ট্র্যাকিং রাখতে সাইটে লগইন করুন।

লগইন করুন
i
ব্যাখ্যা (Explanation):

Production of rice in 1996-1997 = 81 million tonnes

Production of rice in 1999-2000 = 89 million tonnes

∴ Increase in production from 1996-97 to 1999-00 = (89 – 81) million tonnes = 8 million tonnes

Now, percentage increase = (8/81) × 100 ≈ 9.9%

∴ Percentage increase in production of rice in year 1999-2000 over the year 1996-97 is approximately 9.9%

Passage :

Study the given bar graph carefully and answer the questions given below:

Number of people (in thousands) using two different types of mobile service over the years.

i
ব্যাখ্যা (Explanation):

Total number of peoples using mobile service ‘M’ in the year ‘2011’ and ‘2012’ together = (80 + 60) × 1000

= 140,000

i
ব্যাখ্যা (Explanation):

Number of people using mobile service ‘M’ in the year 2009 –

= 60,000

Number of people using mobile service ‘M’ in the year 2013 –

= 50,000

Now,

Required ratio = 60,000 : 50,000

= 6 : 5.

i
ব্যাখ্যা (Explanation):

The number of people using mobile service ‘N’ in the year 2009 –

= 70,000,

The number of people using both the mobile services in the year 2009 –

= (70 + 60) × 1000 = 130,000,

Now,
Required percentage\(= \frac{{70,000}}{{130,000}} \times 100\% = \frac{{700}}{{13}}\% = 53.84\%\)

i.e. approximately 54%

i
ব্যাখ্যা (Explanation):

⇒Total number of peoples using both the two mobile services in the year 2010 –

= (50 + 40) × 1000 = 90,000

⇒Total number of peoples using both the mobile services in the year 2011 –

= (80 + 70) × 1000 = 150,000

Now,
⇒Required percentage \(= \frac{{90,000}}{{150,000}} \times 100\% = 60\%\)

i
ব্যাখ্যা (Explanation):

Total number of people using mobile service ‘M’ for all the years together

= (60 + 50 + 80 + 60 + 50) × 1000 = 300,000

We know that:

Average=sum of elementsnumber of elementsAverage=sum of elementsnumber of elements

Required average=300,0005=60,000

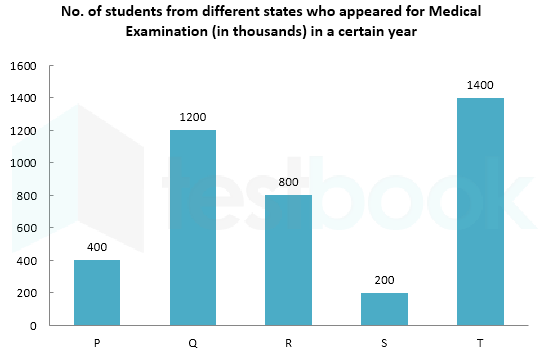
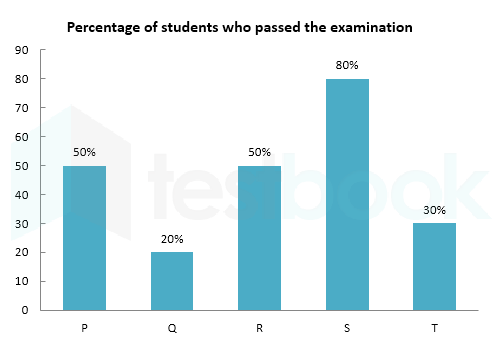
Passage :

Direction: Study the following graphs and answer the following question:

i
ব্যাখ্যা (Explanation):

⇒ Total number of students passed in the states ‘R’ and ‘T’

\(= \left( {\frac{{50}}{{100}} \times 800 + \frac{{30}}{{100}} \times 1400} \right){\rm{thousands}}\)

= 400 + 420

= 820 thousands.

i
ব্যাখ্যা (Explanation):

⇒ Passed student in ‘Q’ = (20/100) ×1200 = 240 thousands,

⇒ Passed students in ‘R’ = (50/100) × 800 = 400 thousands,

∴ Total = (240 + 400) thousand

= 640 thousands.

i
ব্যাখ্যা (Explanation):

⇒ Students passed in state ‘S’ = 80% of 200 =\(\frac{{80}}{{100}} \times 200\)

⇒ Students failed in state ‘S’ = 20% of 200 = \(\frac{{20}}{{100}} \times 200\)

∴ Required ratio = 80/20 = 4/1

⇒ Ratio = 4 : 1.

i
ব্যাখ্যা (Explanation):

⇒ Passed student in ‘Q’ = (20/100) ×1200 = 240 thousands,

⇒ Passed students in ‘R’ = (50/100) × 800 = 400 thousands,

∴ Total = (240 + 400) thousand

= 640 thousands.

ফ্রিতে ২ লাখ প্রশ্নের টপিক, সাব-টপিক ভিত্তিক ও ১০০০+ জব শুলুশন্স বিস্তারিতে ব্যাখ্যাসহ পড়তে ও আপনার পড়ার ট্র্যাকিং রাখতে সাইটে লগইন করুন।

লগইন করুন
i
ব্যাখ্যা (Explanation):

From the given graph it is clear that,

∵ Percentage of Q students who passed = 20%

∴ Percentage Q of students who failed = 100 – 20 = 80%

∴ No. of students who failed are = (80/100) ×1200 thousand

= 960 thousand.

সঠিক উত্তর: 0 | ভুল উত্তর: 0