Pie Chart (20 টি প্রশ্ন )

Passage :

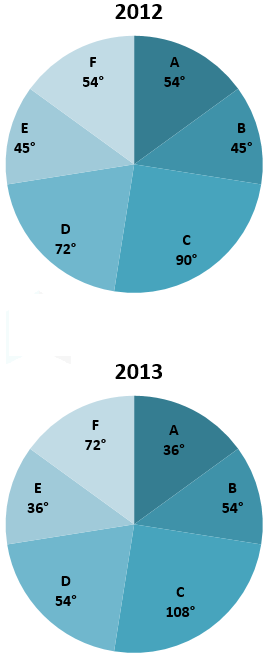
Directions: Study the following pie-charts carefully and answer accordingly. The pie-charts show the distribution of expenses over the six different items A, B, C, D, E and F of a person for 2012 and 2013. He spent Rs. 36000 in 2012 and Rs. 40000 in 2013.


i
ব্যাখ্যা (Explanation):

∵ Total amount spent in 2012 = Rs. 36000

∵ Total amount spent in 2013 = Rs. 40000

∵ Angular share of C in 2012 = 90o

∴ Amounts spent for C in 2012 \(= {\rm{\;}}\frac{{90}}{{360}} \times 36000 = {\rm{Rs}}.{\rm{\;}}9000\)

∵ Angular share of C in 2013 = 108o

∴ Amounts spent for C in 2013 \(= {\rm{\;}}\frac{{108}}{{360}} \times 40000 = {\rm{Rs}}.{\rm{\;}}12000\)

∴ Differences between expenditure in 2012 and 2013 on C = 12000 – 9000 = Rs. 3000

∵ Angular share of D in 2012 = 72o

∴ Amounts spent for D in 2012 \(= {\rm{\;}}\frac{{72}}{{360}} \times 36000 = {\rm{Rs}}.{\rm{\;}}7200\)

∵ Angular share of D in 2013 = 54o

∴ Amounts spent for D in 2013 \(= {\rm{\;}}\frac{{54}}{{360}} \times 40000 = {\rm{Rs}}.{\rm{\;}}6000\)

∴ Differences between expenditure in 2012 and 2013 on D = 7200 – 6000 = Rs. 1200

∴ Sum of the differences between expenditure in 2012 and 2013 = 3000 + 1200 = Rs. 4200

i
ব্যাখ্যা (Explanation):

∵ Total amount spent in 2013 = Rs. 40000

∵ Angular share of A in 2013 = 36o

∴ Amounts spent for A in 2013 \(= {\rm{\;}}\frac{{36}}{{360}} \times 40000 = {\rm{Rs}}.{\rm{\;}}4000\)

∵ Total amount spent in 2012 = Rs. 36000

∵ Angular share of F in 2012 = 54o

∴ Amount spent for F in 2012 \(= {\rm{\;}}\frac{{54}}{{360}} \times 36000 = {\rm{Rs}}.{\rm{\;}}5400\)

∴ Difference = 5400 – 4000 = Rs. 1400

i
ব্যাখ্যা (Explanation):

∴ Amount spent for F in 2012 \(= {\rm{\;}}\frac{{54}}{{360}} \times 36000 = {\rm{Rs}}.{\rm{\;}}5400\)

∵ Total amount spent in 2013 = Rs. 40000

∵ Amount spent for F in 2013 were the same as that in 2012

∴ Angular share in the pie-chart of F \(= \frac{{5400}}{{40000}} \times 360^\circ = 48.6^\circ\)

i
ব্যাখ্যা (Explanation):

∵ Total amount spent in 2012 = Rs. 36000

∵ Number of items from A to F = 6

∴ Average amount spent in 2012 = 36000/6 = Rs. 6000


∴ In 2102, items A, B, E and F is less than Rs.6000 and in 2013 items A and E is less than Rs. 6000

∴ The number of items of 2012 and 2013 on which less money has been spent = 6

i
ব্যাখ্যা (Explanation):

Since it can be seen for the above pie chart that the expenses of the items A, D, and E decreases from 54o to 45o, 72o to 54o and 45o to 36o respectively

∴ Angle subtended by A, D, and E in 2012 = 54o + 72o + 45o = 171o

∵ Total amount spent in 2012 = Rs. 36000

∴ Amount spent on A, D, and E in 2012 \(= \frac{{171}}{{360}} \times 36000 = {\rm{Rs}}.17100\)

∴ Angle subtended by A, D, and E in 2013 = 36o + 54o + 36o = 126o

∵ Total amount spent in 2013 = Rs. 40000

∴ Amount spent on A, D, and E in 2013 \(= \frac{{126}}{{360}} \times 40000 = {\rm{Rs}}.14000\)

∴ Decreased amount of the items = 17100 – 14000 = Rs. 3100

∴ Average of decreased amount of the items A, D, and E = 3100/3 = 1033.33

Passage :

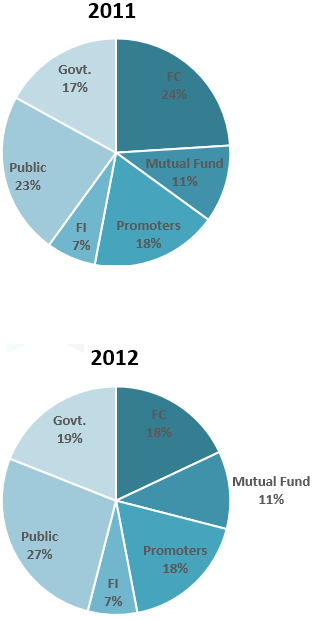
Directions: Study the following pie – chart carefully and answer the questions given below:

Cost estimated by a family in renovation of their house

i
ব্যাখ্যা (Explanation):

% estimation of cost of furniture = 13 %

∴ estimated expenditure on furniture = 13 % of 120000

⇒ estimated expenditure on furniture = 15600

% discount on cost of furniture = 12 %

∴actual amount spent on furniture = 15600 – 12 % of 15600

⇒actual amount spent on furniture = 13728

i
ব্যাখ্যা (Explanation):

⇒ % estimation of cost on painting and flooring = (14 + 15) %

= 29%

∴ cost estimated on painting and flooring together = 29 % of total cost

⇒ cost estimated on painting and flooring together = 0.29 × 120000

⇒ cost estimated on painting and flooring together = Rs. 34800

i
ব্যাখ্যা (Explanation):

% estimation of cost of furniture = 13 %

∴ estimated expenditure on furniture = 13 % of 120000

⇒ estimated expenditure on furniture = 15600

% discount on cost of furniture = 12 %

∴actual amount spent on furniture = 15600 – 12 % of 15600

⇒actual amount spent on furniture = 13728

Given , miscellaneous expenditure = 10200

% amount of all other expenditures except furniture and miscellaneous = (100 – 8 – 13 )% = 79 %

∵ According to question the remaining Estimated cost is Same

⇒ Total amount spent on renovating the house except furniture and miscellaneous spending = 79% of 120000

⇒total amount spent on renovating the house except furniture and miscellaneous spending = 94800

∴ total amount spent on renovating the house = 94800 + 10200 + 13728

⇒total amount spent on renovating the house = 118728

i
ব্যাখ্যা (Explanation):

Total estimated cost = 120000

Total miscellaneous expenditure = 10200

% miscellaneous expenditure of total cost =

( total miscellaneous expenditure / total estimated cost ) × 100 %

⇒ % miscellaneous expenditure = ( 10200 / 120000 ) × 100%

⇒ % miscellaneous expenditure = 8.5 %

ফ্রিতে ২ লাখ প্রশ্নের টপিক, সাব-টপিক ভিত্তিক ও ১০০০+ জব শুলুশন্স বিস্তারিতে ব্যাখ্যাসহ পড়তে ও আপনার পড়ার ট্র্যাকিং রাখতে সাইটে লগইন করুন।

লগইন করুন
i
ব্যাখ্যা (Explanation):

Total cost = Rs. 120000

% estimation to be spent on interior decoration = 19%

∴ estimated amount spent on interior decoration = 19 % of 120000

⇒ estimated amount spent on interior decoration = 22800

% estimation to be spent on architect’s fees = 11 %

∴ estimated amount spent on architect’s fees = 11 % of 120000

⇒ estimated amount spent on architect’s fees = 13200

∴ difference in estimated amount = 22800 – 13200

⇒ difference in estimated amount = 9600

Passage :

Directions: study the following pie-charts carefully and answer accordingly:

The following pie-charts show the share pattern of a company for two different years.

The market capital of the company is Rs 265 cr in 2011 and Rs 260 cr in 2012.

i
ব্যাখ্যা (Explanation):

Total value of mutual funds in 2011 =\(\frac{{11}}{{100}} \times 265 = 29.15{\rm\ {crores}}\)

Number of shares = 29.15 crores53=\(\frac{{29.15\ crores}}{{53}} =\)55 x 105 Shares

i
ব্যাখ্যা (Explanation):

We select sectors with largest and smallest shares.

Between FC and FI in 2011 (It will be max in 2011)

(24 – 7)% of 265

 \(= \frac{{17}}{{100}} \times 265 = 45.05\)

Between Public and FI in 2012 =\(\frac{{27 - 7}}{{100}} \times 260 = 52{\rm\ {crore}}\) (This will be the maximum)

i
ব্যাখ্যা (Explanation):

We can clearly see that for Mutual Funds, promoters and FI, the Percentage has been same for both the years but amount has decreased.

For FC, Both market capitalization value and percentage has decreased.

i
ব্যাখ্যা (Explanation):

There are 2 such sectors : Govt and Public.

For govt:\(\frac{{19}}{{100}} \times 260 - \frac{{17}}{{100}} \times 265{\rm{}} = {\rm{}}49.4{\rm{}}--{\rm{}}45.05{\rm{}} = {\rm{}}4.35\)

For public:\(\frac{{27}}{{100}} \times 260 - \frac{{23}}{{100}} \times 265 = 70.2{\rm{}}--60.95 = 9.25\)

Total = 4.35 + 9.25 crores

= 13.6 crores

i
ব্যাখ্যা (Explanation):

Market capital of Mutual Fund and FC taken together from 2011 = (24 + 11) % of 265

= 35/100 × 265 = 92.75 crores

Market capital of Mutual Fund and FC taken together from 2012 = (18 + 11) % of 260 crores

= 29/100 × 260 = 75.4 crores

Percentage decrease from 2011 to 2012 = \(\frac{{92.75 - 75.4}}{{92.75}} \times 100 = 18.71{\rm{\% }}\)

Passage :

Study the following pie chart and answer the following questions.

i
ব্যাখ্যা (Explanation):

No of teachers = 15% of 26,800 = (26800×15) ÷100 = 4020

Three-fifth are nor permanent, hence two-fifth are permanent.

Permanent teachers = (4020×2) ÷5= 1608

i
ব্যাখ্যা (Explanation):

Employees in Engineering = 9% of 26,800= (26800×9) ÷100 = 2412

Employees in Industries = 13% of 26,800 = (26800×13)÷100 = 3484

Total Number of employees = 2412 +3484 = 5896

i
ব্যাখ্যা (Explanation):

Employees in Film Production= 19% of 26,800 = (26800×19) ÷100 =5092

25 % of the employees went on a strike, hence 75 % have not participated.

75% of 5092 = (5092×75)÷100 = 3819

i
ব্যাখ্যা (Explanation):

Employees in Management = 17% of 26,800 = (26800×17)÷100 = 4556

Female Employees = three-fourth of 4556 = (3×4556)÷4= 3417

Number of male employees = 4556 – 3417 = 1139

ফ্রিতে ২ লাখ প্রশ্নের টপিক, সাব-টপিক ভিত্তিক ও ১০০০+ জব শুলুশন্স বিস্তারিতে ব্যাখ্যাসহ পড়তে ও আপনার পড়ার ট্র্যাকিং রাখতে সাইটে লগইন করুন।

লগইন করুন
i
ব্যাখ্যা (Explanation):

Employees in Teaching = 15% of 26,800 = (26800×15) ÷100 = 4020

Employees in medical = 27% of 26,800 = (26800×27)÷100 = 7236

Total = 4020 + 7236 = 11256

Employees in Management = 17% of 26,800 = (26800×17)÷100 = 4556

Hence, required difference = 11256 – 4556 = 6700

সঠিক উত্তর: 0 | ভুল উত্তর: 0