What is the number of items of 2012 and 2013 on which less money has been spent than the average of 2012?
প্যাসেজ:
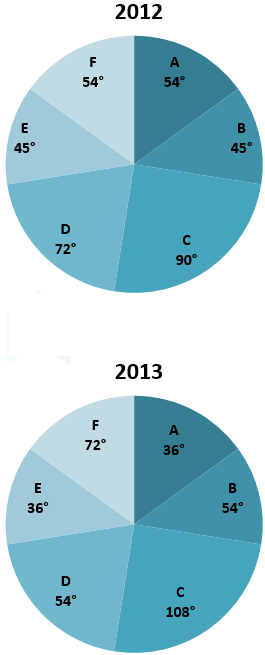
Directions: Study the following pie-charts carefully and answer accordingly. The pie-charts show the distribution of expenses over the six different items A, B, C, D, E and F of a person for 2012 and 2013. He spent Rs. 36000 in 2012 and Rs. 40000 in 2013.
সমাধান
সঠিক উত্তর: Option D
∵ Total amount spent in 2012 = Rs. 36000
∵ Number of items from A to F = 6
∴ Average amount spent in 2012 = 36000/6 = Rs. 6000

∴ In 2102, items A, B, E and F is less than Rs.6000 and in 2013 items A and E is less than Rs. 6000
∴ The number of items of 2012 and 2013 on which less money has been spent = 6
